by Olivia Maynard @OliviaMaynard17
This blog originally appeared on the Mental Elf site on 25th April 2016.
Although many women spontaneously quit smoking when they find out they’re pregnant, approximately 11% of women in the UK continue to smoke during their pregnancy. The health implications of this are estimated to amount to an annual economic burden of approximately £23.5 million.
The NHS Stop Smoking Service provides support for pregnant women to quit smoking during their pregnancy at an annual cost of over £5 million (or £235 per successful quitter). However, despite successful smoking abstinence during pregnancy using this service, many women restart smoking after giving birth (i.e. postpartum), increasing their risk of smoking related diseases and their offspring’s risk of passive smoking and becoming smokers themselves.
Jones and colleagues conducted a systematic review and meta-analysis to investigate just how high the rates of restarting smoking postpartum are among those women who have received support to quit smoking during their pregnancy.
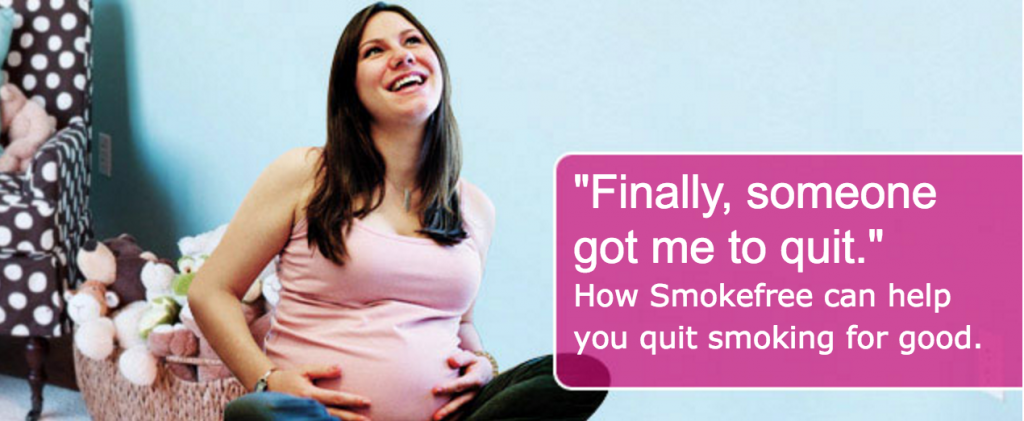
The NHS Stop Smoking Service costs over £5 million every year, but 11% of women in the UK continue to smoke during their pregnancy.
Methods
Selection of included studies
Studies were included if:
- Participants were pregnant smokers who were motivated to quit smoking (to ensure that participants were similar to those women who actively seek out Stop Smoking Services during their pregnancy)
- Interventions aimed to encourage smoking cessation during pregnancy, with control group participants receiving placebo, another cessation intervention or no intervention
- Outcome measures were continuous abstinence from the end of pregnancy to at least one postpartum follow-up, or 7-day point prevalence abstinence (i.e. not smoking for the past 7 days) at both the end of pregnancy and at least one postpartum follow-up. Where biochemically validated abstinence was not available, self-reported abstinence was accepted.
Primary outcome measure
- Longitudinally collected continuous abstinence data, among those women who reported abstinence at the end of their pregnancy and were in the intervention condition (i.e. had received Stop Smoking Service support).
Secondary outcome measure
- The overall rates of smoking prevalence (using point-prevalence data) following childbirth across all women.
Results
Study characteristics
27 studies were included in the review. Of these:
- 4 reported continuous abstinence only (i.e. can be used for the primary outcome measure only);
- 7 reported both continuous abstinence and point-prevalence (i.e. can be used for both the primary and secondary outcome measures);
- 16 reported point-prevalence only (i.e. can be used for the secondary outcome measure only);
20 studies were randomised controlled trials (RCTs) with individual randomisation, 5 were cluster randomised and 2 were quasi-randomised.
To minimise differences between the included studies, only data from similar time-points were synthesised. Postpartum follow-up time-points were as follows:
- 6 weeks (including data from 10 days and 4, 6 and 8 weeks postpartum);
- 3 months (data from 3 and 4 months);
- 6 months (data from 6 and 8 months);
- 12 months;
- 18 months;
- 24 months.
Risk of bias assessment
- Studies were screened and data extracted by two reviewers;
- The quality of included studies was generally judged to be poor;
- Only 8 (of 27) studies included an intention to treat analysis;
- Only 18 studies used biochemically validated abstinence;
- There was evidence of publication bias.
Primary analysis: proportion re-starting smoking
The primary analysis only included those 11 studies reporting continuous abstinence, including a total of 571 women who reported being abstinent at the end of their pregnancy.
By 6 months postpartum, 43% (95% CI = 16 to 72%, I2 = 96.7%) of these women had restarted smoking.
The subgroup analysis of those studies using biochemically validated abstinence measures included only 6 studies and found that by 6 months 74% of women (95% CI = 64 to 82%) had restarted smoking.
Secondary analysis: proportion smoking
The secondary analysis only included those 23 studies reporting point-prevalence abstinence, including a total of 9,262 women.
At the end of pregnancy, 87% (95% CI = 84 to 90%, I2 = 93.2%) of women were smoking and at 6 months this was 94% (95% CI = 92 to 96%, I2 = 88.0%).
The 17 studies using biochemically validated abstinence observed rates of smoking at the end of pregnancy of 89% (95% CI = 86 to 91%, I2 = 91.2%) and 96% at 6 months postpartum (95% CI = 92 to 99%, I2 = 70.7%).
Using these cross-sectional point-prevalence data, it is also possible to estimate the proportion of women restarting smoking postpartum. These data suggest that 13% of women were abstinent at the end of their pregnancy, but only 6% were abstinent at 6 months, which is equivalent to 54% restarting smoking postpartum.

In clinical trials of smoking cessation interventions during pregnancy, only 13% of female smokers are abstinent at term.
Conclusion
The authors conclude that:
Most pregnant smokers do not achieve abstinence from smoking while they are pregnant, and among those that do, most will re-start smoking within 6 months of childbirth.
They also note that this means that the considerable expenditure by NHS Stop Smoking Services to help pregnant women quit smoking is not having as big an impact on improving the health of women and their offspring as it might.
Limitations
- There was considerable variability between the included studies (i.e. the I2 statistic was high). The authors attempted to minimise this variability by aggregating data at similar time-points and only including those studies where women consented to join (i.e. were motivated to quit smoking)
- Only a few studies reported longitudinal continuous abstinence data, restricting the amount of data which could be included in the primary analysis.
Discussion
This is the first study to systematically investigate the rate of restarting smoking postpartum and provide data on the effectiveness of the Stop Smoking Services provided to pregnant women.
Using continuous postpartum abstinence rates, 43% of women who had received a smoking cessation intervention and were abstinent at the end of their pregnancy had restarted smoking after 6 months. Using data from the cross-sectional point-prevalence data, a similar rate of restarting was observed.
These results are generalisable to those pregnant women who seek support from Stop Smoking Services. Although no reviews have investigated the rates of restarting smoking among those women who spontaneously quit smoking during their pregnancy, individual studies suggest that the rates are broadly similar at between 46 and 76%.

Nearly half (43%) of the women who do stop smoking during their pregnancy, re-start smoking within 6 months of childbirth.
Links
Primary paper
Jones M, Lewis S, Parrott S, Wormall S, Coleman T. (2016) Re-starting smoking in the postpartum period after receiving a smoking cessation intervention: a systematic review. Addiction, doi: 10.1111/add.13309.
Photo credits
– See more at: http://www.nationalelfservice.net/populations-and-settings/pregnancy/rates-of-restarting-smoking-after-giving-birth/#sthash.iSRFc5w5.dpuf


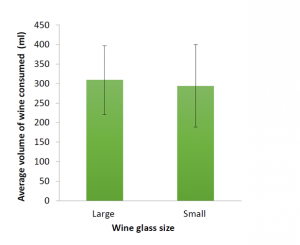 smaller glasses. As this study wasn’t powered to detect a meaningful difference between the two groups, we weren’t really surprised by this finding. However, these pilot data, along with the lessons learned from conducting the study will be used to inform our future research studies and grant applications.


 Nine months later I was on my way to Heathrow for a two month stint collecting data on a cannabis administration study. I was both excited and apprehensive. I have never lived more than a 3 hour drive away from family, and have always been in a city where I have known people. I didn’t know whether I would get homesick, or whether I would make friends on my trip abroad. These feelings of apprehension soon disappeared in the first few hours of my first day at the New York Psychiatric Institute. Everyone I met was so friendly and welcoming, even the many morning commuters who stopped to help the lone Brit who was obviously puzzled by the subway map at 7.30am.
 I was to spend the next six weeks collecting data for a study examining the neuro-behavioural mechanisms of decisions to smoke cannabis at the Substance Use Research Center in the New York Psychiatric Institute at Columbia University. This research centre is unique; it is one of the largest drug administration centre in the world and has licenses to administer a wide variety of drugs, including cannabis, cocaine and heroin. This means that much of the research conducted here is cutting edge. The aim of the study that I would be working on was to shed light on how and why drug abusers repeatedly make decisions to take drugs despite substantial negative consequences. The study used brain imaging (fMRI) to examine the neural and behavioural processes involved in decisions to self-administer cannabis, compared to decisions to eat food, in regular cannabis users. We also examined the influence of drug and food cues on the processes underlying these decisions. To do this, participants were recruited as inpatients and stayed with us in the lab for a week. Data collection for this study is still ongoing, but I will be sure to write another blog post with what we found when the results are available.
 I found this research fascinating and it was a pleasure to be involved in the work carried out in this department. The experience was made even more enjoyable by the people I was working with. There were many office conversations about the British and American slang that was being used, many lunchtime trips to Chipotle (an American fast food restaurant that I am definitely missing since my return to the UK), and several Friday evening trips to the local Irish bar. One office memory that will always stick in my mind was meeting a very accomplished researcher in the field of my PhD, a researcher that was definitely someone I should be impressing. Upon entering this individuals office on an extreme
 I did, of course, take every opportunity to explore New York. I was lucky enough to get tickets to watch the New York Yankees beat the Boston Red Sox at the Yankee Stadium, which was also one of the last games played by baseball-legend Derek Jeter. I made several trips to the American Natural History Museum (my favourite type of museum, and this one cannot be done in a day), and while there saw a live spider show, a 3D film about Great White Sharks and a full T-Rex skeleton. The glorious weather allowed for several leisurely strolls around Central Park. And, of course, the American food definitely needs a mention. If anyone reading this takes a trip over the Atlantic, I would definitely recommend visiting Big Daddy’s Diner for what could be the best milkshake on the planet. And don’t be shy about trying a hotdog from one of the carts that can be found on nearly every street corner. The reason there are so many of them is that they’re delicious! I would also recommend a trip to the Russian Tea Rooms for caviar afternoon tea, an evening at the New York Metropolitan Opera (if that’s your cup of tea), and a trip to Coney Island.
 Although it was daunting going abroad for that length of time to begin with, I don’t think I would be having those feelings again and I would definitely jump at any opportunity to work in a different environment in the future. I am very grateful that I am a PhD student in a large working group like TARG, as without this I probably would not have come across opportunities such as this one. This experience has taught me the importance of inter-disciplinary research, and the need for several fields contributing evidence to a much larger research question. Since this trip, I have been successful in a fellowship application allowing me 9 months in a different department at the University of Bristol, an application that I probably would not have made if it wasn’t for my experience at the Columbia University. I am an epidemiologist and do not have any plans to change that; however I do plan to conduct more interdisciplinary research in the future. I would like to that Gill (and everyone in her lab group) for welcoming me and making this trip possible. I look forward to hopefully working with you again in the future…